HSBC SuperTrust Plus vs. AIA Prime Value Choice: Top Low-FER MPF Showdown
The two leading low-FER trustees for Hong Kong MPF personal-account consolidation: compare 0.82% vs. 0.83% US equity trackers, 0.82% vs. 0.84% global equity funds, and 20 vs. 27 constituent funds.
Last verified: 2026-11-20 · Official policy wordings and trustee disclosures always prevail.
Key Takeaways
- Near-identical low-FER equity core: HSBC (0.82% US / 0.82% Global; 5Y 10.33% / 9.69%) vs. AIA (0.83% American / 0.84% World; 5Y 10.34% / 9.08%).
- AIA's American Fund (10Y 12.17%) and World Fund (10Y 10.15%) carry full 10-year MPFA track records plus a broader 27-fund shelf; HSBC excels in banking-app simplicity.
- Both dramatically undercut 1.50%–1.80% active schemes — choose based on fund shelf breadth vs. banking ecosystem convenience.
Visual Comparison
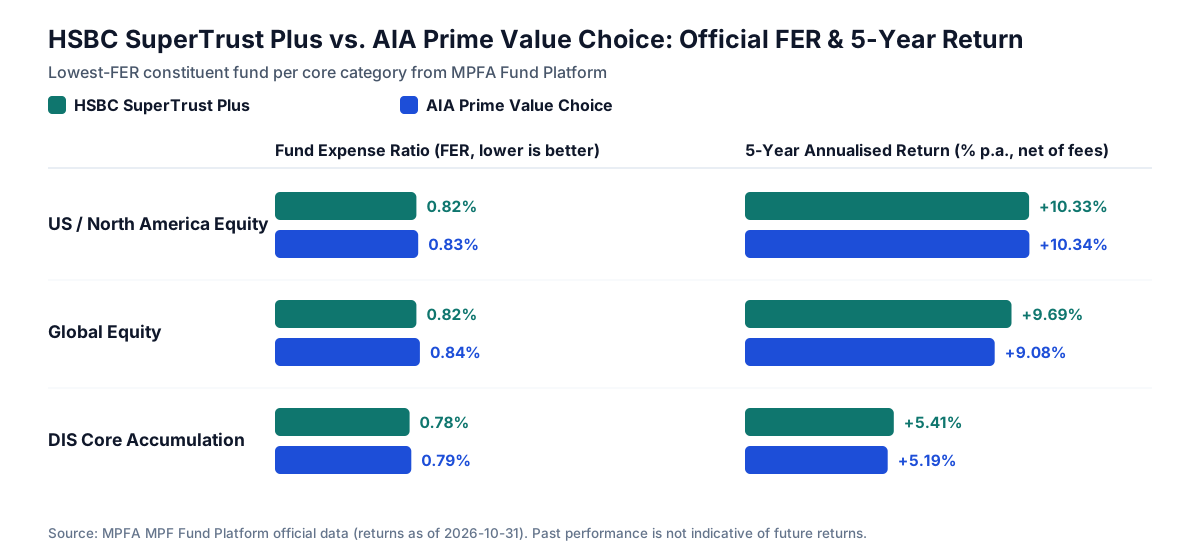
Clause-by-Clause Matrix
0.77% – 2.05%
0.78% – 1.69%
ValueChoice North America Equity Tracker Fund (FER 0.82% · 5Y 10.33%)
American Fund (FER 0.83% · 5Y 10.34% · 10Y 12.17%)
Global Equity Fund (FER 0.82% · 5Y 9.69%)
World Fund (FER 0.84% · 5Y 9.08% · 10Y 10.15%)
Core Accumulation Fund (FER 0.78% · 5Y 5.41% · 10Y 6.89%)
Core Accumulation Fund (FER 0.79% · 5Y 5.19%)
All 20 constituent funds tracked directly from the official MPFA Fund Platform (as of 2026-10-31). · FER spans 0.77%–2.05% (avg 1.13%), alongside statutory fee-capped DIS funds.
All 21 constituent funds tracked directly from the official MPFA Fund Platform (as of 2026-10-31). · FER spans 0.78%–1.69% (avg 1.25%), alongside statutory fee-capped DIS funds.
FER can vary by more than 1% p.a. between index/DIS funds and active equity funds within the same scheme. · Consolidating or transferring via ECA involves a brief out-of-market cash settlement window.
FER can vary by more than 1% p.a. between index/DIS funds and active equity funds within the same scheme. · Consolidating or transferring via ECA involves a brief out-of-market cash settlement window.
| Clause-by-Clause Matrix |  HSBC Mandatory Provident Fund - SuperTrust Plus |  AIA MPF - Prime Value Choice |
|---|---|---|
| Constituent Fund Classes | 20 | 21 |
| FER Range (Lowest – Highest) | 0.77% – 2.05% | 0.78% – 1.69% |
| Simple Average FER | 1.13% | 1.25% |
| Lowest-FER US / North America Equity | ValueChoice North America Equity Tracker Fund (FER 0.82% · 5Y 10.33%) | American Fund (FER 0.83% · 5Y 10.34% · 10Y 12.17%) |
| Lowest-FER Global Equity | Global Equity Fund (FER 0.82% · 5Y 9.69%) | World Fund (FER 0.84% · 5Y 9.08% · 10Y 10.15%) |
| DIS Core Accumulation Fund | Core Accumulation Fund (FER 0.78% · 5Y 5.41% · 10Y 6.89%) | Core Accumulation Fund (FER 0.79% · 5Y 5.19%) |
| Key Strengths | All 20 constituent funds tracked directly from the official MPFA Fund Platform (as of 2026-10-31). · FER spans 0.77%–2.05% (avg 1.13%), alongside statutory fee-capped DIS funds. | All 21 constituent funds tracked directly from the official MPFA Fund Platform (as of 2026-10-31). · FER spans 0.78%–1.69% (avg 1.25%), alongside statutory fee-capped DIS funds. |
| Watch-outs | FER can vary by more than 1% p.a. between index/DIS funds and active equity funds within the same scheme. · Consolidating or transferring via ECA involves a brief out-of-market cash settlement window. | FER can vary by more than 1% p.a. between index/DIS funds and active equity funds within the same scheme. · Consolidating or transferring via ECA involves a brief out-of-market cash settlement window. |
CoverHK · HSBC SuperTrust Plus vs. AIA Prime Value Choice: Top Low-FER MPF Showdown
Want a tailored clause check or exact numbers?
Share your age band, existing corporate medical cover, or current MPF trustee — we will reply in writing with a clear side-by-side summary.